The aim of segmentation, the fourth facet of Supplier Relationship Management (SRM), is to divide your supply base into discrete groups according to their importance. This is done through the application of segmentation criteria, applied on a supplier-by-supplier basis.
To do this you ideally need a cross-functional workshop which involves carefully selected participants, ideally between five and seven, who take part in facilitated discussions and debates.
Once the segmentation process is complete you then need to determine the interventions required for each group. It may sound straightforward but one size definitely does not fit all and interventions can take many forms.
While the segmentation process determines who is important, it’s the outputs from segmentation, and specifically the basis upon which a supplier has been deemed important, that determine the degree and nature of intervention required.
When developing approaches for a specific supplier, you will need to refer back to the basis upon which they were determined to be important. As an example, if a supplier is important because there is risk to our brand due to practice in the supply chain then our interventions need to focus on the supply chain, perhaps through Supply Chain Management (SCM). Alternatively, a supplier who is important due to current knowledge of our business and a high spend might need close management through Supplier Management (SM).
One of the biggest challenges you will face is making sense of the outputs recorded during the segmentation workshop. However, it’s these outputs – the notes, scores, lists, discussion and debate – that will help you develop the right interventions for specific suppliers.
You may think that designing a segmentation system based upon scoring suppliers against a series of criteria, and then adding these up is what is needed. However, if you do this, you run the risk of excluding a supplier which has a low total score but scores highly against a key criterion such as risk. That supplier would definitely need an intervention.
As a result, we need to preserve a series of scores individually so that we can take a view of all the factors that might make them important.
While there may be a complex mathematical model which could do this, I personally don’t think I’ve ever seen one that is completely effective. Instead, what’s required here is brainpower combined with an informed judgement to allow us to assimilate the vast amounts of information.
This isn’t a new or unique problem. Marketeers face similar issues when analysing a competitor landscape or comparing product attributes, so they use visual tools which tend to be the most effective at providing a basis for human judgement.
Creating a visual representation of the suppliers’ evaluations against each criterion will help us to quickly evaluate a number of suppliers to determine which are important and why. To do this, take the segmentation charts, mark up the scores on each one then join them together to create a unique shape as per the examples below.
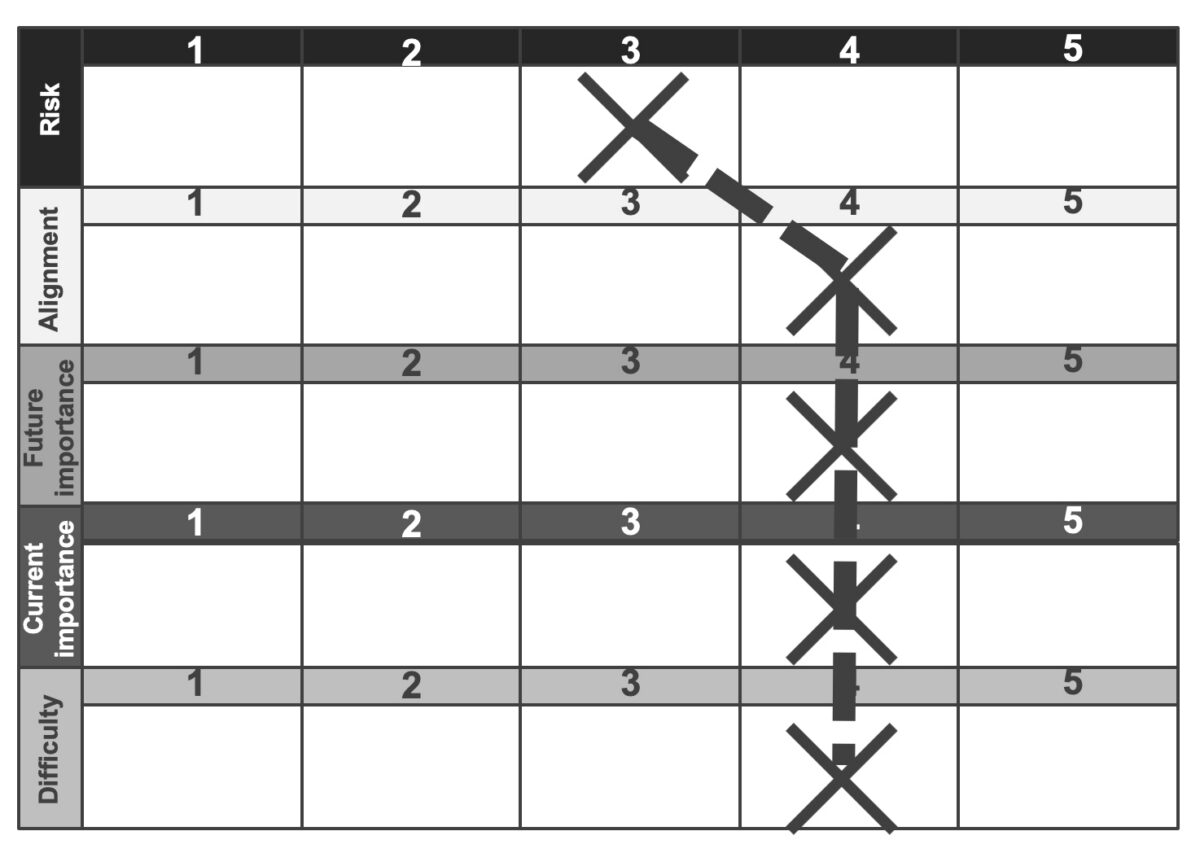
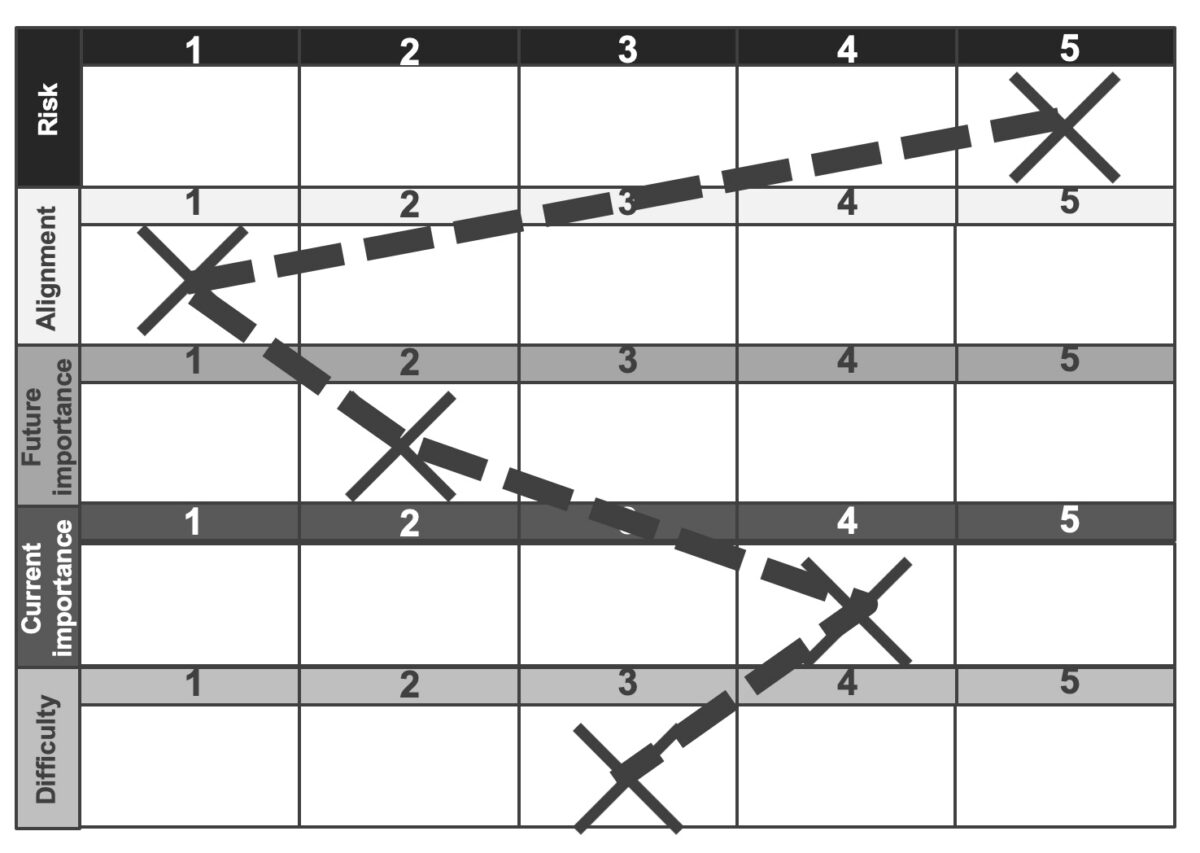
This visual shows two suppliers, each with a very different shape which was created during the segmentation process. On the left, is an outsourced partner with high spend who is important today and for the future. On the right is a supplier who presents a significant degree of risk to us and where there is high spend. The obvious question is which one should we be spending time with? Believe it or not, it’s actually both, but in different ways. We need to build a relationship with one supplier and assess and manage risk of the other.
There are also many other types of graphical representation that can be used. A good old bar chart or radar diagram are both sound and easily accessible using Excel or similar. I, however, favour the ‘coxcomb graphic’, which was apparently first used by Florence Nightingale to illustrate levels of mortality over time and which is now popular with statisticians and communications experts who are looking for a good ‘infographic’.
The key point here is that by using a visual method, we can compare the different segmentation shapes to decide which suppliers need what intervention.
This article is adapted from 2nd edition Supplier Relationship Management: Unlocking the Hidden Value in Your Supply Base (9780749480134) by Jonathan O’Brien © 2018 and reproduced by permission of Kogan Page Ltd. It first appeared on the Supply and Demand Chain Executive website on February 8, 2019.
Jonathan O’Brien, CEO of Positive Purchasing Ltd, is a leading expert on procurement and negotiation, and works with global blue-chip organizations to help transform their purchasing capability.